📈Interactive Reports📈
Dropdown
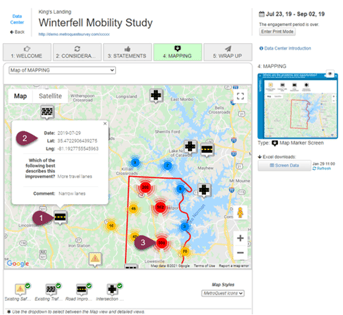
- Google map overlaid with every marker placed.
- Clicking on a marker shows the date placed, exact latitude and longitude coordinates, and any comments, if applicable.
- When zoomed out, the map is a heatmap showing areas with the highest volume of markers, while zooming in displays each individual marker

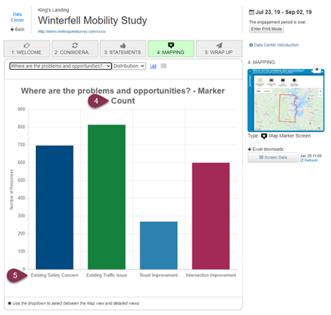
- Screen Title – Marker Count - Bar graph displaying the times each marker was placed
- A section is reserved for each marker and labeled by name. This features a single bar graph showing the number of times the marker has been placed
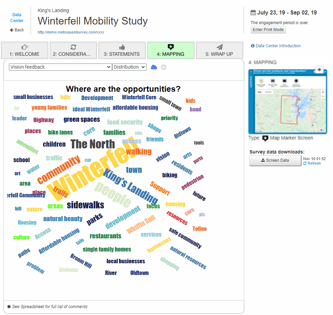
- A word cloud of the most frequently used words in the comment section
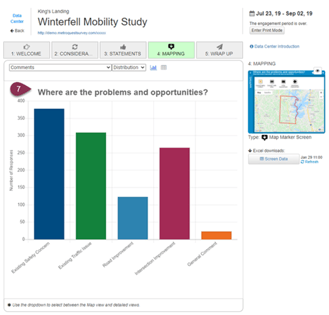
- Comments – Bar graph displaying the number of individual comments on each marker, in addition to the number of general screen comments. This is just numerical data; the actual comments are displayed in the excel downloads.
⬇️Excel Downloads⬇️
These are spreadsheets containing numerical Data. You can download onto your computer for analysis.
- Mapping Chart
- Table and associated bar graph displaying the total amount placed and comments left for each marker
- Map Marker Summary
- Table displaying the number of each marker placed, separated into each URL on mobile and web platforms
- All Mappings
- Comprehensive list of all markers placed by any participant. Contains information including visit time, site visited, platform used, latitude and longitude, drop order, and answers to the marker questions
- Comments
- A list of general screen comments and the time at which they were submitted