Examples
In the provided examples, the Surveys demonstrate how the Priority Ranking Screen is linked to the Scenario Rating Screen. By displaying the rated priorities as indicators on the Screen, participants can easily identify which scenario aligns with their priorities, helping them make well-informed decisions.
When to Use It
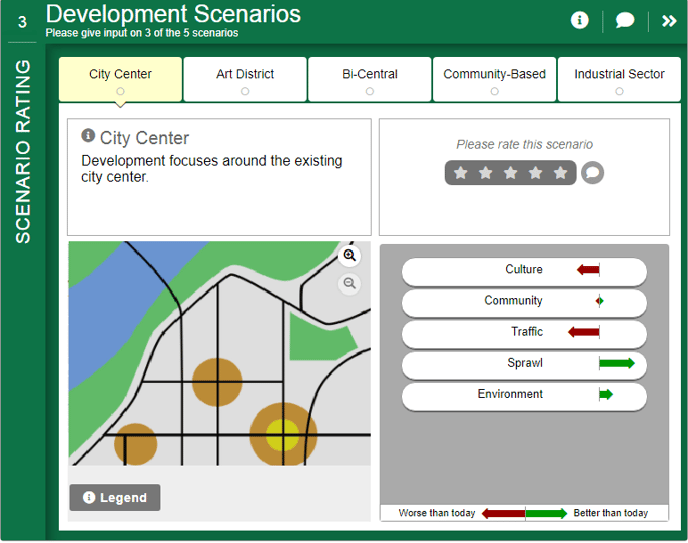
The Scenario Rating Screen allows visitors to learn about and rate different scenarios, plans, or options.
- Use this Screen to allow visitors to compare multiple performance metrics of a set of possible scenarios. It is an effective educational tool as well as a way to collect input.
- This Screen works best when there is a map associated with each scenario, but the images used to represent each scenario could also be a diagram or photo.
- The optional indicators show how each scenario might perform relative to today, or to a current trend.
- The indicators can be pulled from a Priority Ranking Screen earlier in the survey and show performance on the items that visitors have already indicated are priorities.
- Visitors give a 5-star rating on some or all scenarios, and can add optional comments.
- If there are a large number of scenarios, or they are relatively simple, the Visual Preference and Image Rating Screens can be used to ask users to give their input on a variety of plans. However, it is not advisable to use either of those Screens for complex scenarios as it makes for an onerous task for visitors.
How to Build It
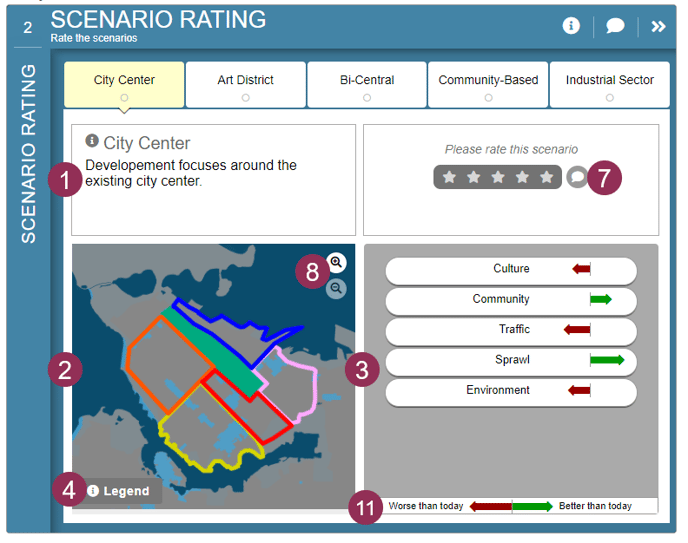
This Screen can contain between 2 to 8 scenarios, each with a description, image/map and optional indicators.
Content you'll need to prepare:
- Labels and descriptions for up to 8 scenarios
- A map, diagram or image for each scenario, registered to be viewed on top of each other
- Optional indicator scores for each indicator, for each scenario, from 1-99, where 50 is the middle
- An optional legend for the map
Decisions you'll need to make:
- The number of scenarios (2 to 8)
- Whether or not there is extra popup info about each scenario
- Whether or not to allow for optional comments
- Whether or not to show indicators (1 to 12)
- If the indicators are connected to priorities from a previous Screen
- Whether or not there is an optional legend for the map
- Whether the indicators are comparing scenarios to a base year or a future baseline or trend scenario
Keys To Success
- The Scenario Rating Screen is designed to allow participants to compare scenarios or plan options in their entirety. It does this by highlighting how each scenario differs from the other. Make sure the scenarios are different enough so that participants will be able to notice the differences when toggling between them.
- The map visualization area works best when there are clear differences between scenarios. Avoid complex maps or maps with subtle differences.
- The 5-star rating scale is a common mainstream rating system that does not require further explanation.