A new tool available for your data assessment is the Sentiment Analysis. This is available on the four screens with optional text answer questions: Standard Survey, Map Marker, Vision Statement, and Wrap Up Screens. In order to view the Sentiment Analysis for an eligible screen, simply select the specific question in the dropdown and click the “Smiley Face” icon to the right.

Sentiment Analysis is, at its core, a natural language process technique used to determine whether data is positive, negative, or neutral. An algorithm picks out key words of participants’ comments and uses computational linguistics and biometrics to predict the nature of the said comment.
A multi-colored bar graph is generated based on the results of the Sentiment Analysis. The total bars represent the number of comments on each specific day, while the different colors represent the comment's classification as determined by the Sentiment Analysis. The horizontal bar on the bottom of the screen displays the total percentage of each type of comment.
Language Compatibility
- English (Word Cloud Available)
- French (Word Cloud Available)
- Spanish (Word Cloud Available)
- Chinese Simplified
- Chinese Traditional
- Japanese (Word Cloud Available)
- Korean (Word Cloud Available)
- German (Word Cloud Available)
- Italian (Word Cloud Available)
- Norweigian (Word Cloud Available)
- Portuguese - Brazil (Word Cloud Available)
- Portuguese - Portugal (Word Cloud Available)
- Turkish
How Does Sentiment Analysis Work?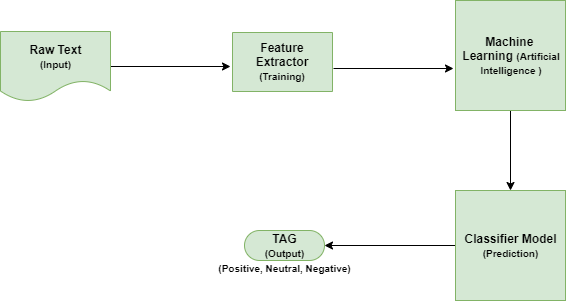
Firstly, the participant’s response, named Raw Text in the diagram, is sent to the Feature Extractor to classify the subset word sentences into different training vectors algorithm.
The results from the Feature Extractor will record in Machine Learning (Artificial Intelligence). Machine Learning will compare the received data with the already existing local database word bank definitions.
Lastly, if the local interpreter finds that the data already exists, it will continue to match the existing tags (i.e., positive, negative, or neutral) with the output data. On the other hand, new data definitions will move to the classifier model, which generates predicted tags (i.e., positive, negative, or neutral).
