Online tools that collect input on complex topics like transportation or regional planning generally have many benefits and can help achieve a variety of outcomes, such as consensus building, insight into public opinion, public support, project communications and so on. While statistical significance can be an important success criterion for surveys and polls, for most public engagement professionals, statistical significance, in the literal sense, is often not generally a focus or an important success factor. More so, most public engagement professionals are attempting to engage as many people as possible, and to obtain as much meaningful information as possible to the degree the participants are willing to share their opinions.
Many public engagement software tools, including MetroQuest support these objectives by making it easy for participants to contribute data (without a need for registering with personal information), to also allow participants to provide partial responses (meaning the participants can choose which question(s) they reply to) and to contribute in an anonymous manner where they do not have to answer demographic questions if they choose, although most do. As such, the public engagement professionals using tools like MetroQuest often acquire a vast amount of data from a sizeable segment of the population, but it would be difficult to conclude that the survey is deemed to be statistically significant in the literal sense of the term.
The idea of statistical significance in public engagement is most commonly associated with market research or polling. In these situations, polling firms often contact participants from a known list of people. Typically, these firm develop lists of possible participants so they can recruit the right number of respondents from the right demographic sub-group or cohort. If you know the demographic characteristics of your respondents, which is the case for polling firms, it is possible to create a statistically relevant survey.
The downside is these situations is that the poll only recruits participants that are on the list; many people on these lists receive compensation to participate. To that end, by definition, if public engagement professionals followed the protocol for statistical significance, they would eliminate the opportunity for the vast majority of the affected community to contribute to the planning and engagement process. This runs contrary to the primary goals of most public engagement initiatives.
At the root of statistical significance is a consideration of the sample size, or number of people surveyed as well as the science of statistics. According to Wikipedia, “[t]he sample size is an important feature of any empirical study in which the goal is to make inferences about a population from a sample.”
To create a statistically relevant survey, it is necessary to reach a certain number of respondents in each demographic cohort. For instance, it may be the case that respondents are divided into groups based on age and gender.
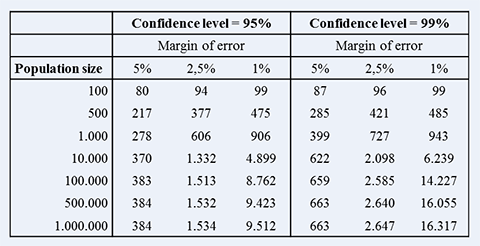
In this example, there is a desire to understand the responses across 8 cohorts. To be statistically relevant, there needs to be a minimum number of respondents in each cohort. The number required depends in part on the total population size.
| Age | Female | Male |
| 0 - 19 | Cohort 1 | Cohort 2 |
| 20 - 39 | Cohort 3 | Cohort 4 |
| 40 - 59 | Cohort 5 | Cohort 6 |
| 60+ | Cohort 7 | Cohort 8 |
Below is a simple sample size calculator (Note this doesn't include cohorts, just total population).

So, in addition to having enough respondents in total, it is also essential to have enough respondents in each cohort.
Although using tools like MetroQuest to engage the public at large is technically not considered statistically significant, some public engagement professionals may choose to use charts like the one above to provide guidance as to the number of participants they deem satisfactory. They also recognize that though some public engagement topics are of more interest to the public than others, and some initiatives only affect a small portion of the population, either geographically or demographically.
It should be noted that public engagement professionals typically use a variety of methods and tools to engage the public on various topics, including public meetings, online community forums, comment boards, and a variety of survey type tools. None of these methods or tools would be considered statistically significant, but collectively they can contribute the public engagement success.
Agencies and firms using MetroQuest have often stated they were able to engage 10 to 20 times the number of participants they’ve previously engaged with other methods and tools. Additionally, these professionals have stated that they’ve often far surpassed their goals regarding the amount and quality of the data collected. And in turn, these high levels of participation and data collection have often led to more informed planning and investment decisions for many agencies.
The examples below highlight the success of some MetroQuest clients:
Regional Transportation Commission of Southern Nevada, Regional Transportation Plan
Regional Transportation Commission of Southern Nevada, Regional Transportation Plan
6,800 Participants
25,000 Priority Rankings
29,000 Trade-off Inputs
60,000 Budget Coins Allocated
Nashville nMotion Transit Plan
Saugatuck- A Gateway for Westport, CT – Master Plan Visionin
Saugatuck- A Gateway for Westport, CT – Master Plan Visioning (Population 26,000)
1,370 Participants
3,1000 Scenario Ratings
4,200 Trade-off Inputs
3,700 Visual Preference Inputs
Okotoks (Cimarron) Traffic Calming (Population 24,500)
Okotoks (Cimarron) Traffic Calming (Population 24,500)
1,280 Participants
4,770 Priority Rankings
14,870 Image Ratings
Belmont Bridge
Lancaster County, PA Comprehensive Plan
Lancaster County, PA Comprehensive Plan
1,600 Participants
14,000 Priority Ratings
4,200 Scenario Ratings
1,900 Organized Comments