📈Interactive Reports📈
- Visitor: Anyone who visits the Survey URL
- Participant: A subset of Visitors that submits at least 1 data point on the Survey
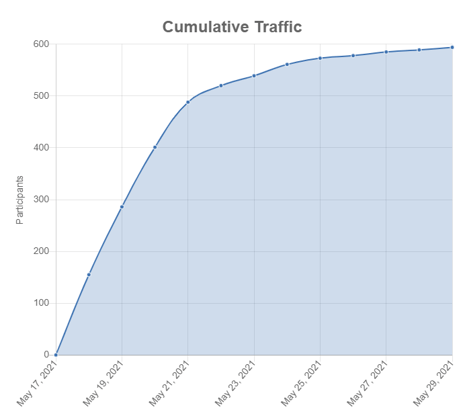
Cumulative Traffic: Line graph illustrating the cumulative number of participants throughout the Survey.
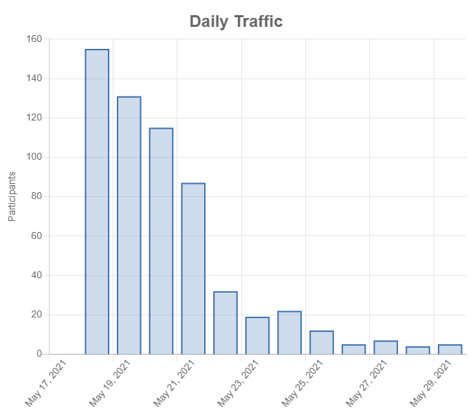
Daily Traffic: Bar graph illustrating the number of participants per day.
Participation Rate: Pie chart illustrating the ratio of participants to visitors.

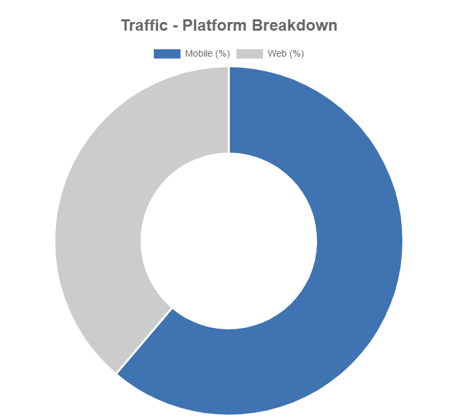
Platform Breakdown: Pie chart illustrating the ratio of visitors who accessed the Survey from the web version vs the mobile version.
Daily Traffic by URL: Bar graph illustrating the number of participants per day for each survey URL(If there is only one Live URL, this will be identical to the Daily Traffic graph)
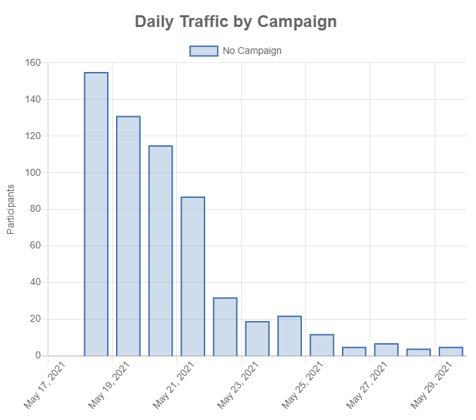
Daily Traffic by Campaign: Bar graph illustrating the number of participants per day for each survey Campaign

Survey Data Points
- The number of total data points submitted by all participants
- Data points include rankings, ratings, map marker placements, Survey question responses, and comments.
- The average number of data points per participant
- A pie chart breaking down the data points for each screen
- A list featuring the quantities of the different types of data points on each screen
⬇️Excel Downloads⬇️
These are spreadsheets containing numerical Data. You can download onto your computer for analysis.
- Traffic Data
- Total by URL: The total number of visitors and participants for each Live URL.
- Aggregated by Day: A breakdown of the visitors and participants on each day
- All Visit: A line by line breakdown of every visitor. Displays Visit ID, Visit Time (in UTC-7), the URL visited, whether or not they were a participant, and the IP address.
- Crosstab Data
- A comprehensive spreadsheet is displaying all activities of every participant. This includes all the information in the Traffic Data “All Visits” sheet, in addition to the platform used (Web or Mobile), the browser, and specific data they inputted on each screen (How many items ranked/rated, comments, demographic question answers, etc.)
- Session Data
- Another comprehensive spreadsheet is displaying line by line each data point submitted by every participant. This can be useful for detecting duplicate “ballot box stuffers.”