📈Interactive Reports📈
- Screen Title and Bar graphs displaying the number of times each question was answered. This applies to all questions including dropdown, button, checklist, textbox and comment answer variables, except for the private question.
- Dropdown menu allows you to navigate among different questions with a bar graph of the answers and how many times each was selected.
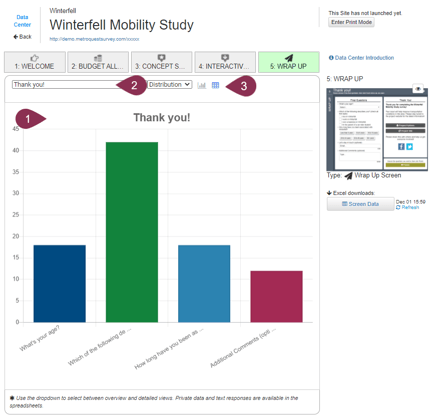
- Bar graph and Table view toggle: Please see the image on the right for the table example.
.png?width=500&height=420&name=table%20(1).png)
Question Variables:
- Dropdowns, Buttons, and Checklist: There is a bar graph of the answers and how many times each was selected.

- Dropdowns, Buttons, and Checklist: There is a bar graph of the answers and how many times each was selected.
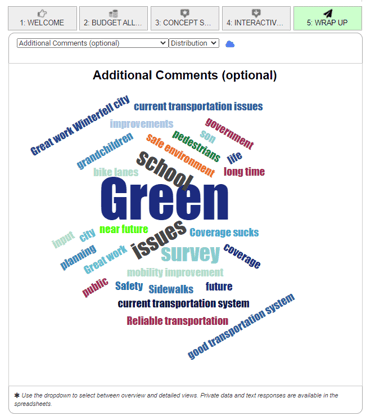
- Textboxes and Comments: WordCloud displaying keywords from responses
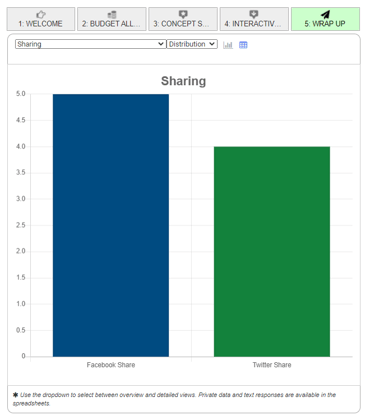
- Sharing: Bar graph displaying the number of times the Facebook and Twitter icons were clicked to share the Survey.
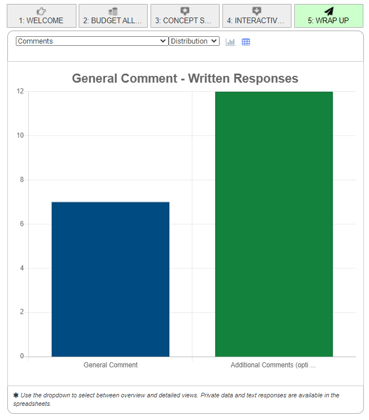
- Comments: Bar graph displaying the list of comment questions including Screen general comment and the number of comments left.
⬇️Excel Downloads⬇️
These are spreadsheets containing numerical Data. You can download onto your computer for analysis.
- Demographic Charts
- Table displaying the number of times each demographic question option was selected. A pie chart is made for each question based on these results. Additionally, the number of times the survey was shared on Facebook and Twitter is also reported.
- Demographic
- Table displaying Visitor ID and time, platform used, specific question answered, and option selected for all dropdown and button questions.
- Private
- Table displaying Visitor ID and time, platform used, specific question answered, and text submitted for all private textbox questions. The most used private variable question is “What is your email?”
- Other
- Table displaying Visitor ID and time, platform used, specific question answered, and option(s) selected for all checkbox questions.
- Comments
- Table displaying Visitor ID and time, platform used, specific question answered, and text submitted for all longer comment questions.
- Sharing
- Table displaying Visitor ID and time, platform used, and social media site (Facebook/Twitter) shared on
🗺️📍 Heatmap Zip/Postal Codes 📍🗺️
The Heat Map for zip/postal codes is a feature in your Survey settings that allow you to view the map in the Data Center for codes that have been submitted by participants on the Wrap up Screen. Survey managers will be able to easily view and download the heat map in the Data Center and collect data on where the participants are taking the Survey from.

1) In your Wrap Up Survey Screen, create a question requesting the participant's zip/postal code. Go into your Survey you would like to add this feature to and toggle the zip/postal code option on.

2) Once your Survey is in the engage phase, participants who enter a valid zip/postal codes will be collected for the data canter.
3) Once your Survey has completed the Engage phase and is now ready to analyze, you can go into the Data Center and select Screen 5 or the Wrap Up Screen to see the data your Survey has collected.

Please note that only valid zip/postal codes will be collected and shown in your Heatmap. Any invalid zip/postal codes will not be displayed on the heat map. However, the data will still be collected and visible in the excel report.
Related Articles:
- Data Center Introduction: You can access the Data Center during the Engage and Analyze phase through your Survey Dashboard. The Data Center is where you check out interactive reports and the Excel files with your data set.
- Ballot Box Stuffing: MetroQuest removes barriers, such as email sign-ups and restrictions on IP Addresses, to participation. It is recommended that you filter your data set to fit your criteria during the Analyze Phase.
- Statistical Significance: You can find more information about public involvement and statistical significance. Online engagement tool's contribution to public engagement success.